Documentation Index
Fetch the complete documentation index at: https://levelblue-final.mintlify.app/llms.txt
Use this file to discover all available pages before exploring further.
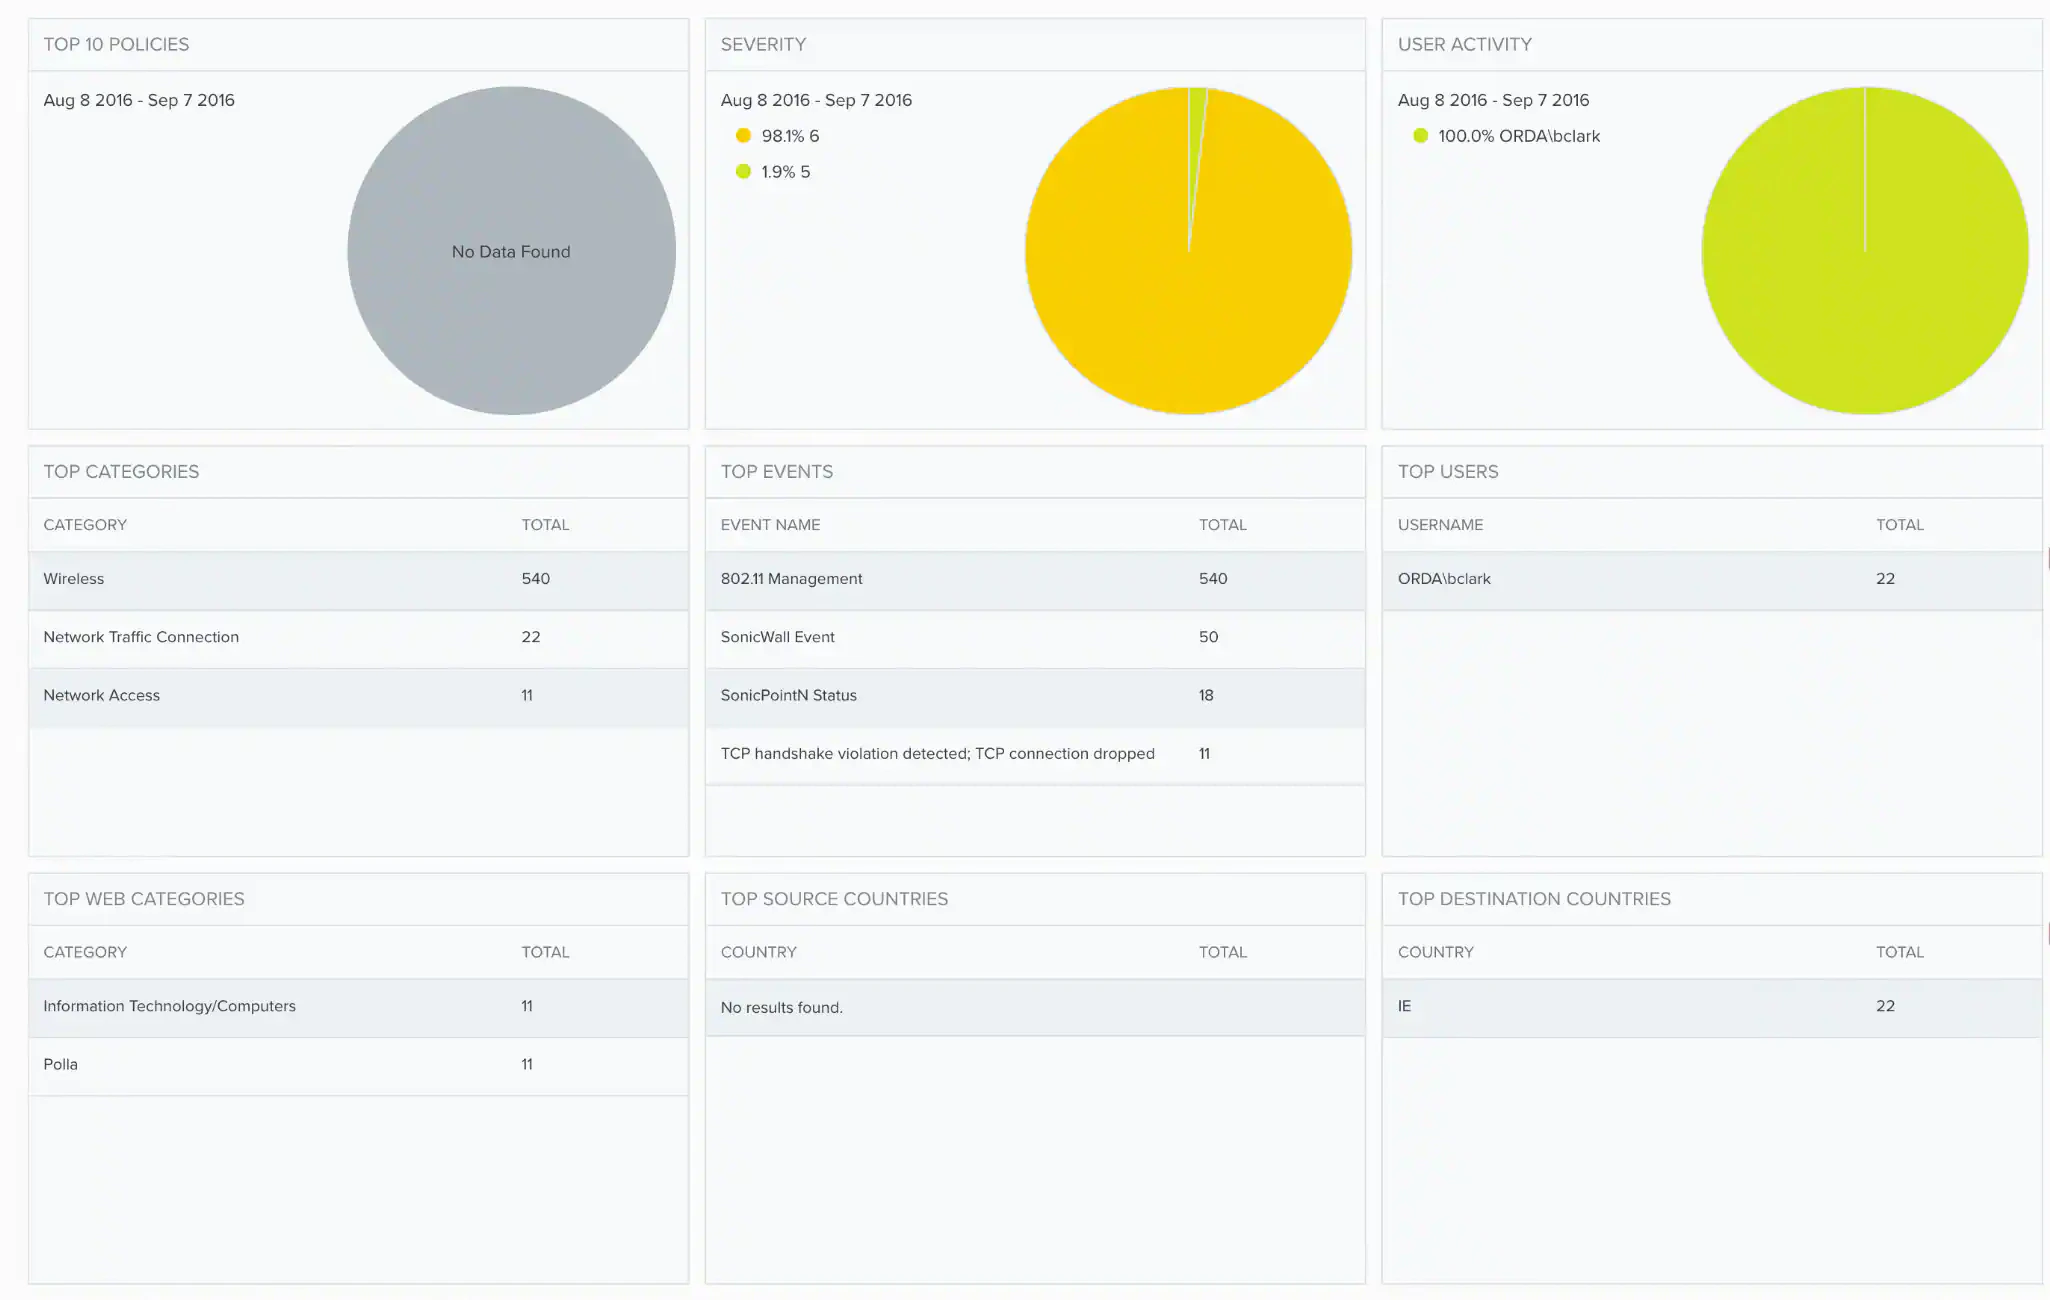
| Role Availability | Read-Only | Investigator | Analyst | Manager | Depending on the USM Anywhere Sensor you have installed, the widgets might be visible in the SonicWall dashboard. This dashboard displays data when the SonicWall data source has been configured. |
| Widget | Description |
|---|---|
| Top 10 Policies | Pie chart displaying, in percentages, the top ten SonicWall policies. |
| Severity | Pie chart displaying, in percentages, the top event severity. |
| User Activity | Pie chart displaying, in percentages, the top users by activity. |
| Top Categories | List of the top categories expressed in total numbers. |
| Top Events | List of the top SonicWall events expressed in total numbers. |
| Top Users | List of the top users expressed in total numbers. |
| Top Web Categories | List of the top web categories expressed in total numbers. |
| Top Source Countries | List of the top source countries expressed in total numbers. |
| Top Destination Countries | List of the top destination countries expressed in total numbers. |